It’s often said that UK general election results fail to represent the electorate accurately. There’s some truth to this.
The UK’s First Past the Post (or Single Member Plurality, if we’re being comparative political scientists about it) electoral system distributes parliamentary seats to parties based not on the share of the vote they win in the country as a whole, but whether they come first in any of 650 separate constituencies. This rewards larger parties, and those with more concentrated vote shares, over smaller, more diffuse parties. To put it into context, at the 2015 general election the SNP won 8.62% of the seats in the House of Commons with 4.7% of the national vote, while UKIP won 0.15% of the seats on 12.9% of the vote. 2015 was a bad year for the Lib Dems anyway, but they, too, usually lose out similarly.
The advantage of this system is supposed to be that it makes forming stable single-party majority governments easier. That, in turn, promotes what is known as ‘responsible’ government. Voters can choose a party confident in the knowledge that, if it wins, it will probably be able to get its manifesto commitments through parliament. If, at the next election, they judge that it has failed, they can relatively easily vote it out. Under FPTP, voters choose a government. Under more proportional systems, they choose a parliament – and parliament chooses a government. What the government actually does in a more proportional system will likely reflect post-election elite bargaining as much as voter choice.
At the same time, however, FPTP allows parties to gain absolute power (and in the UK’s ‘elective dictatorship’, with its doctrine of absolute parliamentary sovereignty, it usually is absolute power) despite only winning a minority of the votes cast. As figure 1 shows, no government elected since 1945 has won a majority of the votes cast, yet all but three have won a majority of seats in the House of Commons. On two occasions – the Conservatives in 1951, and Labour in February 1974, the party that came second in terms of vote share won more seats and wound up forming the government.

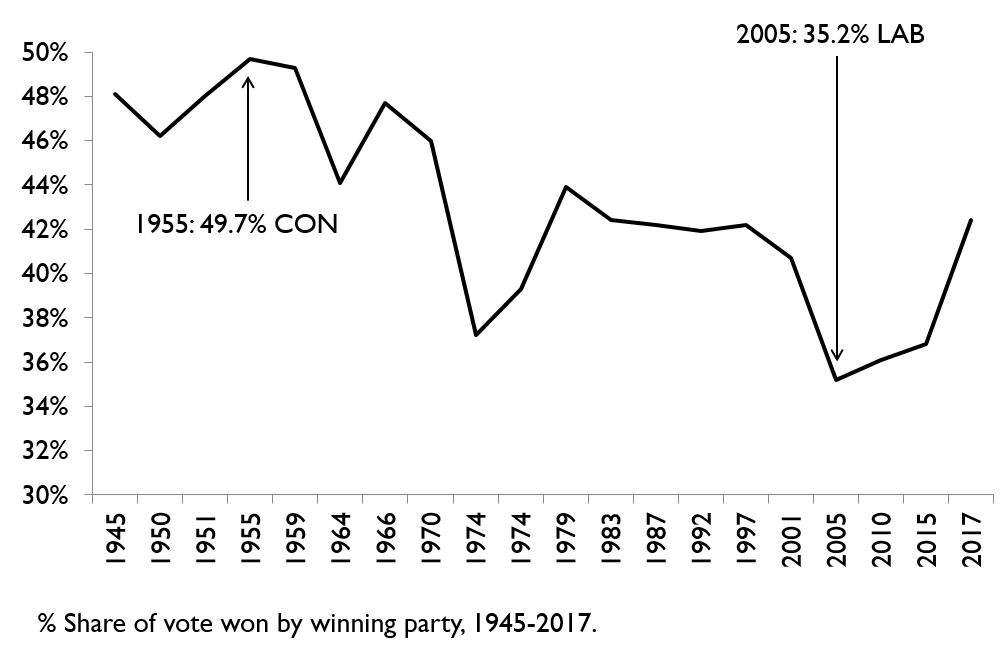
Over time, the share of the vote needed for a majority has fallen, as voters have shifted allegiances away from the two largest parties. As figure 2 illustrates, the Conservatives won 49.7% of the vote in 1955, and a majority of 60. Labour won 35.2% of the vote in 2005, and a majority of 66. In 1951, the Conservatives gained 1.07% of the seats in the House of Commons for every 1% of the vote they won. In 2005 Labour gained 1.57% of the seats for every 1% of the vote. The exaggerative bias of the system has worsened.
As figure 3 shows, in 1951, 96.8% of voters voted either Labour or Conservative. In 2010 just 65.1% did so. To put it another way, nearly 97% of voters in 1951 voted for either the outgoing Labour government or the incoming Conservative government. In 2010, 35% of voters chose a party that had not been in power in the postwar era.

Ailsa Henderson has shown that voters are generally satisfied with the electoral system provided their preferred party wins power at a national level at least some of the time – but that they start to lose faith in the fairness of the system if their side never gets to win. What Figure 3 shows is that, since the 1950s, the proportion of voters whose side never wins has gradually risen. That partially explains the legitimacy crisis facing parliament in the aftermath of the Brexit vote. As Rob Saunders has put it, “When four million people vote UKIP, as in 2015, and are rewarded with a solitary MP, we should not be surprised if they view parliament as something done to them by an external elite”.
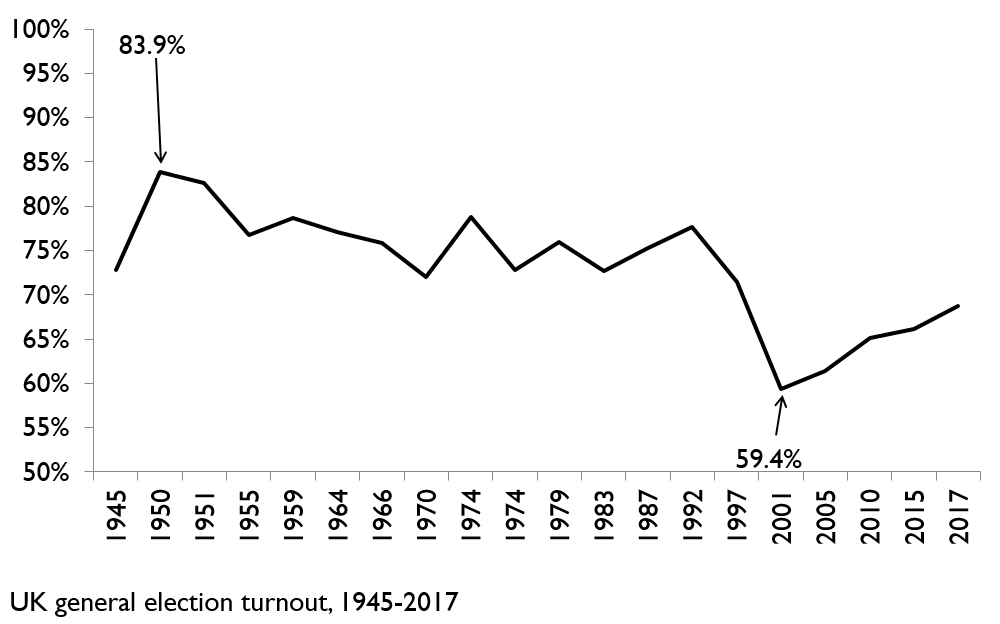
One reason why most pollsters failed to predict the Brexit vote was that a large number of people who did not vote in general elections turned out for the referendum. Those people disproportionately voted Leave. As figure 4 shows, turnout has fallen in line with the share of votes going to Labour and the Conservatives. In 1950, 84% of eligible voters actually voted. In 2001, just 60% did so. As Oliver Heath argues, the decline in turnout arose especially among working-class voters, as Labour shifted toward the middle class under Tony Blair: “the class divide in participation has become greater than the class divide in vote”
If we then look at the interaction between declining turnout and partisan dealignment – the increasing willingness of voters to switch parties between elections, and to vote for parties other than the two largest – the picture becomes even more bleak.
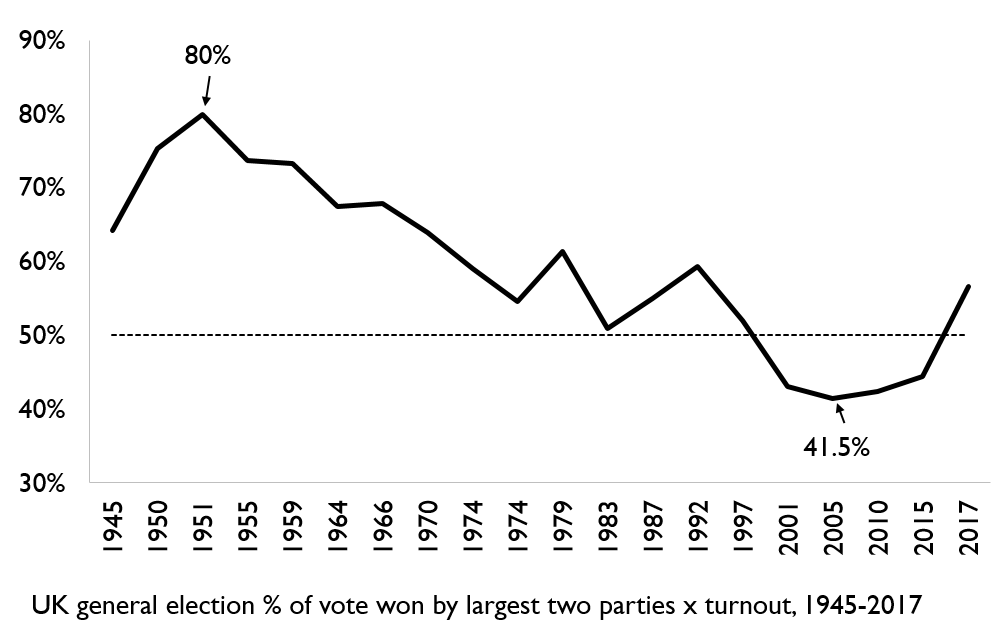
As figure 5 shows, the share of possible votes won by the two largest parties has plummeted from well above 50% – 80% of all eligible voters in 1951 voted either Labour or Conservative – to below 50%, with a particular nadir in 2005. Just 41.5% of eligible voters voted either Labour or Conservative in that year. Out of everyone eligible to vote in 2005, nearly 60% did not vote for one of the two parties that had wielded absolute power in the UK since 1945. Given Henderson’s findings about faith in democracy, that looks like a problem. Given Heath’s findings about the differential decline in faith in voting among working class voters, it looks like an especially acute one. While it isn’t true that working class voters determined the Brexit result – there aren’t enough of them left to win a majority on their own, and in fact most Brexit voters were comfortable, middle class, English conservatives – working class resentment at a political system that appeared to be failing to represent them clearly is part of the story.
How does all of this play out at a constituency level? In a multi-party system, you don’t need to win a majority of votes in your local area to get elected to parliament. You just need to win more votes than any other candidate. I wondered how many MPs were actually elected despite a majority of voters in their constituency voting for someone else – an important question in light of current debates around the merits of tactical voting.
I found, as table 1 shows, that some 26.8% of MPs elected in the 2017 election won less than 50% of the vote in their constituency. That was actually lower than I expected. It reflected the shift back to big-party voting that characterized the 2017 election, with Labour and the Conservatives winning 82% of the vote between them. It also reflected the relative concentration of their votes. Smaller parties, generally, were more likely to win seats despite winning less than 50% of the local vote – this was true of all 35 of the SNP’s seats, for example – generally because they had to beat both Labour and the Conservatives in order to win.
| MPs elected on: | <50% of vote | ||
| n | % | ||
| All MPs | 650 | 174 | 26.8% |
| Con | 317 | 74 | 23.3% |
| DUP | 10 | 5 | 50.0% |
| Green | 1 | 0 | 0.0% |
| Ind | 1 | 1 | 100.0% |
| Lab | 262 | 40 | 15.3% |
| LD | 12 | 11 | 91.7% |
| PC | 4 | 4 | 100.0% |
| SF | 7 | 4 | 57.1% |
| SNP | 35 | 35 | 100.0% |
| Spk | 1 | 0 | 0.0% |
Table 1
26.8% doesn’t sound too bad. That means that 73.2% of MPs won more than 50% of the votes cast in their constituency, giving them the right to claim to speak for the majority of local people. I looked these figures up after claiming in a lecture that less than 50% of MPs won more than 50% of the vote, and had to correct myself.
The picture looks different, however, if we again factor in turnout. Once we consider the share of available votes won by each MP, rather than just the share of votes cast, the number of MPs able to claim they speak for a majority of their constituents falls precipitously. As table 2 shows, just 27 MPs – 24 Labour, 2 Conservatives, and the Speaker – won more than 50% of the available votes. 95.8% of MPs won office despite a majority of eligible voters in their constituency either not voting, or voting for someone else.
| MPs elected on: | <50% of vote | <50% of constituents | |||
| n | % | n | % | ||
| All MPs | 650 | 174 | 26.8% | 623 | 95.8% |
| Con | 317 | 74 | 23.3% | 315 | 99.4% |
| DUP | 10 | 5 | 50.0% | 10 | 100.0% |
| Green | 1 | 0 | 0.0% | 1 | 100.0% |
| Ind | 1 | 1 | 100.0% | 1 | 100.0% |
| Lab | 262 | 40 | 15.3% | 238 | 90.8% |
| LD | 12 | 11 | 91.7% | 12 | 100.0% |
| PC | 4 | 4 | 100.0% | 4 | 100.0% |
| SF | 7 | 4 | 57.1% | 7 | 100.0% |
| SNP | 35 | 35 | 100.0% | 35 | 100.0% |
| Spk | 1 | 0 | 0.0% | 0 | 0.0% |
Table 2
These figures further underline the problems with the UK’s electoral system. Most MPs win office with the support of a minority of eligible voters in their local area. Most governments win absolute power with the support of a minority of actual voters, and an even smaller minority of eligible voters, in the country. People lose faith in democracy when it seems to be incapable of representing their views adequately. That is clearly happening in the UK, now.
